Chapter 16: Financial Modeling
Financial Modeling
This chapter contains:
- Directions for Setting Up Financial Modeling
- How to Run Financial Modeling Reports
Set Up Financial Modeling
To provide you with a tool to increase your agency's profit, there is a feature in Trams Back Office called Financial Modeling. It summarizes your agency's statistics on one piece of paper and allows you to analyze them to establish goals for your business.
Financial Modeling can be used after Bank Reconciliation, ARC/BSP Reconciliation, EOP Core Report Balancing, and the Month End routine are complete. After the monthly Income Statement and Balance Sheet, Financial Modeling is the final step of monthly analysis of your business.
To set up the Financial Modeling feature do the following:
1. Click Utilities|Setup|Global Defaults and click on the Financial Modeling tab.
2. Enter your Agency Information:
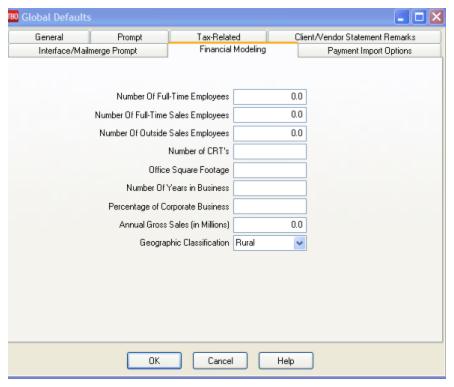
Financial Modeling Entry Fields
|
Number of Full-Time Employees |
Enter your agency’s number of full-time employees. |
|
Number of Full-Time Sales Employees |
Enter your agency’s number of full-time sales employees. |
|
Number of Outside Sales Employees |
Enter your agency’s number of outside sales employees. |
|
Number of CRT’s |
Enter the number of Customer Reservation Terminals in your agency. |
|
Office Square Footage |
Enter the square footage of the agency. |
|
Number of Years In Business |
Enter the number of years your agency has been in business. (Used for external peer comparisons.) |
|
Percentage of Corporate Business |
Enter the percentage of corporate business your agency performs. (Used for external peer comparisons.) |
|
Annual Gross Sales (in Millions) |
Enter your agency’s gross sales (in millions). (Used for external peer comparisons.) |
|
Geographic Classification |
From the drop-down menu, select Rural, Urban or Metro for the geographic classification for your agency. (Used for external peer comparisons.) |
3. Click OK to save.
4. Next, click on General Ledger|Accounts (this is the area where you set up the Chart of Accounts). If you are setting up the Chart of Accounts to allow your Agency to do Financial Modeling, you need to set up Sales (4000 series); Cost of Sales (5000 series); and Expenses (6000, 7000, 8000 & 9000 series) in the following manner:
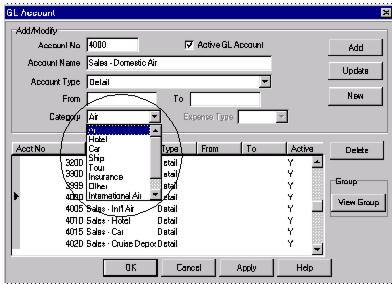
5. For every Sales (4000 series) and Cost of Sales (5000 series) account, choose a Category Type from the drop-down menu. Choices include: Air, Hotel, Car, Ship, Tour, Insurance, Other, International Air, Service Fees, or Unrelated Income or Rail. This is a suggested setup for your chart of Accounts for use of the Financial Modeling Module. ( Please contact your accountant for any changes that they may want you to consider for your final setup).
6. For every Expense (6000 series) account, choose a Category type (Compensation; Operations, Marketing, Occupancy; Travel/Entertain/Travel; Communication; Other; Allocated Profit), and an Expense Type. Choices include Fixed or Variable (see below for details).
This is a suggested setup for your Chart of Accounts for use of the Financial Modeling Module. ( Please contact your accountant for any changes that they may want you to consider for your final setup):
Fixed Costs
Fixed costs are those expense items, which generally do not change, in the short run, regardless of how much you sell. They are not influenced by the hours the business operates or the level of its sales. (Leases, rent, wages to a certain extent, insurance, maintenance, utilities, automobile, and advertising are examples of Fixed Costs).
Wages have the characteristics of fixed and variable costs. Wages can be fixed or variable depending on the particular circumstances of the business. If an employee is a permanent full time employee, the cost of ordinary hours and associated costs and annual vacation, etc. could be construed as fixed. If you employ casual employees, ones paid on commission, these would be variable costs.
Variable Costs
Variable costs are costs that increase and decrease with the activity of the business. Generally, these costs increase with increased sales because they are directly involved in making the sale. Examples of variable costs include Cost of Sales, sales commissions, and billing costs. If you are not sure which list is right for a particular expense item, use this test to determine if it is fixed or variable. Ask yourself: “If I did not have any sales during the next month, would I still have to pay this expense?” If the answer is yes, that item is a fixed cost. If you aren't sure which they are consider them fixed.
Above (under Step 5. and Step 6. is a suggested setup for your chart of Accounts for use of the Financial Modeling Module. ( Please contact your accountant for any changes that they may want you to consider for your final setup)
7. Next go to Utilities|Setup|GL Accounts:
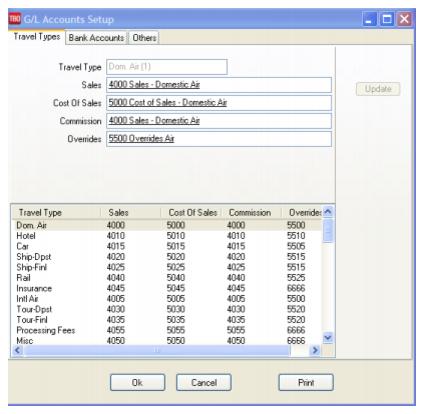
To run a Financial Modeling Report that matches your Income Statement, it is important for you point the Commission Income Accounts under the 4000 and 5000 series to a unique Chart of Accounts Number. If not using Commission Income accounts, these can be set to the error account 6666. For example:
Correct: Domestic Air Sales - 4000
Cost of Sales - 5000
Commission Income - 4100
Override - 5500
Incorrect: Domestic Air Sales - 4000
Cost of Sales - 5000
Commission Income - 4000
Override - 4000
If you have changed the Comm Track Payment in EOP setting under Utilities|Setup|Global Defaults|Prompt to Commission Income, set-up a unique account number (i.e. 4100 series) in the Chart of Accounts for the Commission Income accounts for each travel type. Then come back into this section and “point” the Commission Income section to the new accounts you have set up. Now your reporting will be accurate.
Important Note: If you have not used all of the Travel Type slots, use what is known as an “error account” as the account number for the unused slots. If an amount accidently “falls” into one of these areas that does not have an account number, you now have a way of retrieving the figures by printing out activity in the 6666 Account and putting transactions contained therein into the correct account.
Financial Modeling Reports
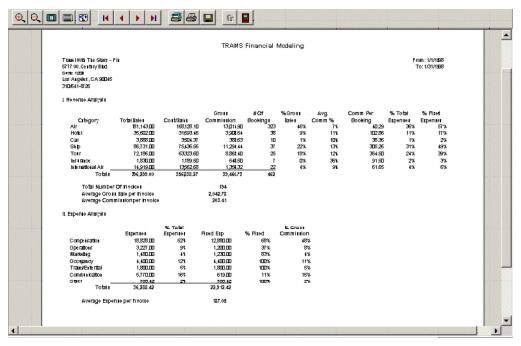
To run Financial Modeling Reports, go to Reports|Financial Modeling and print out the Analysis Report for review. This report is divided into 3 sections - Review Analysis; Expense Analysis; and Management Analysis:
Revenue Analysis includes Total Sales, Cost of Sales, Number of Bookings, Percent of Gross Sales, Average Commission Percentage, Commission per Booking, Percentage of Total Expenses, and Percentage of Fixed Expenses by Travel Type. It also shows the Total number of invoices, the Average Gross Sales per invoice, and average commission per invoice.
The Expense Analysis section gives an expense break down by Expense Category. It shows what each category is as a percent of total expenses. Find out your fixed versus variable spending, and your average expense per invoice.
Management Analysis compares Sales, Revenue, and Expense Totals, along with Total Invoices, Bookings and Segments per Employee, per Sales Agent, per CRT, and per square foot.
Note: The number of Employees used to calculate the Per Employee column is using the Number of Full Time Employees field plus the Number of Outside Sales Employees field set up under Utilities|Setup|Global Defaults|Financial Modeling Tab. If you have 7 Full Time Employees and 1 Outside Sales Employee, the Total Number of Employees used for calculating the Per Employee column would be 8.